Stock Market Trends and Investor Moves: Earnings, Technicals, Psychology
Learn how to decode earnings reports, use technical indicators, and understand investor psychology to make smarter investment decisions.
Analyzing Financial Reports and Market Health
Earnings reports are more than just numbers; they reveal a company's financial health and future prospects. When a company beats analyst expectations on revenue or earnings per share, it often signals strong management or favorable market conditions. Consistently beating estimates builds a track record of excellence and can indicate sustainable growth. Beyond the headlines, investors should also examine company guidance and management commentary. Forward-looking statements provide insight into how executives view the business environment, and their tone can influence stock prices. Operational metrics like profit margins, inventory levels, and segment performance add further context, helping investors distinguish between superficial growth and lasting strength.
Stock market indexes such as the S&P 500 act as economic barometers, reflecting investor sentiment and broad economic trends. When corporate earnings rise and consumer spending remains robust, indexes tend to climb. The labor market plays a crucial role: high employment supports spending, while shifts in employment data can sway market directions. Investor sentiment, shaped by policy changes, geopolitical events, and economic forecasts, also drives index movements. Understanding these interconnections helps investors align their strategies with the broader market.
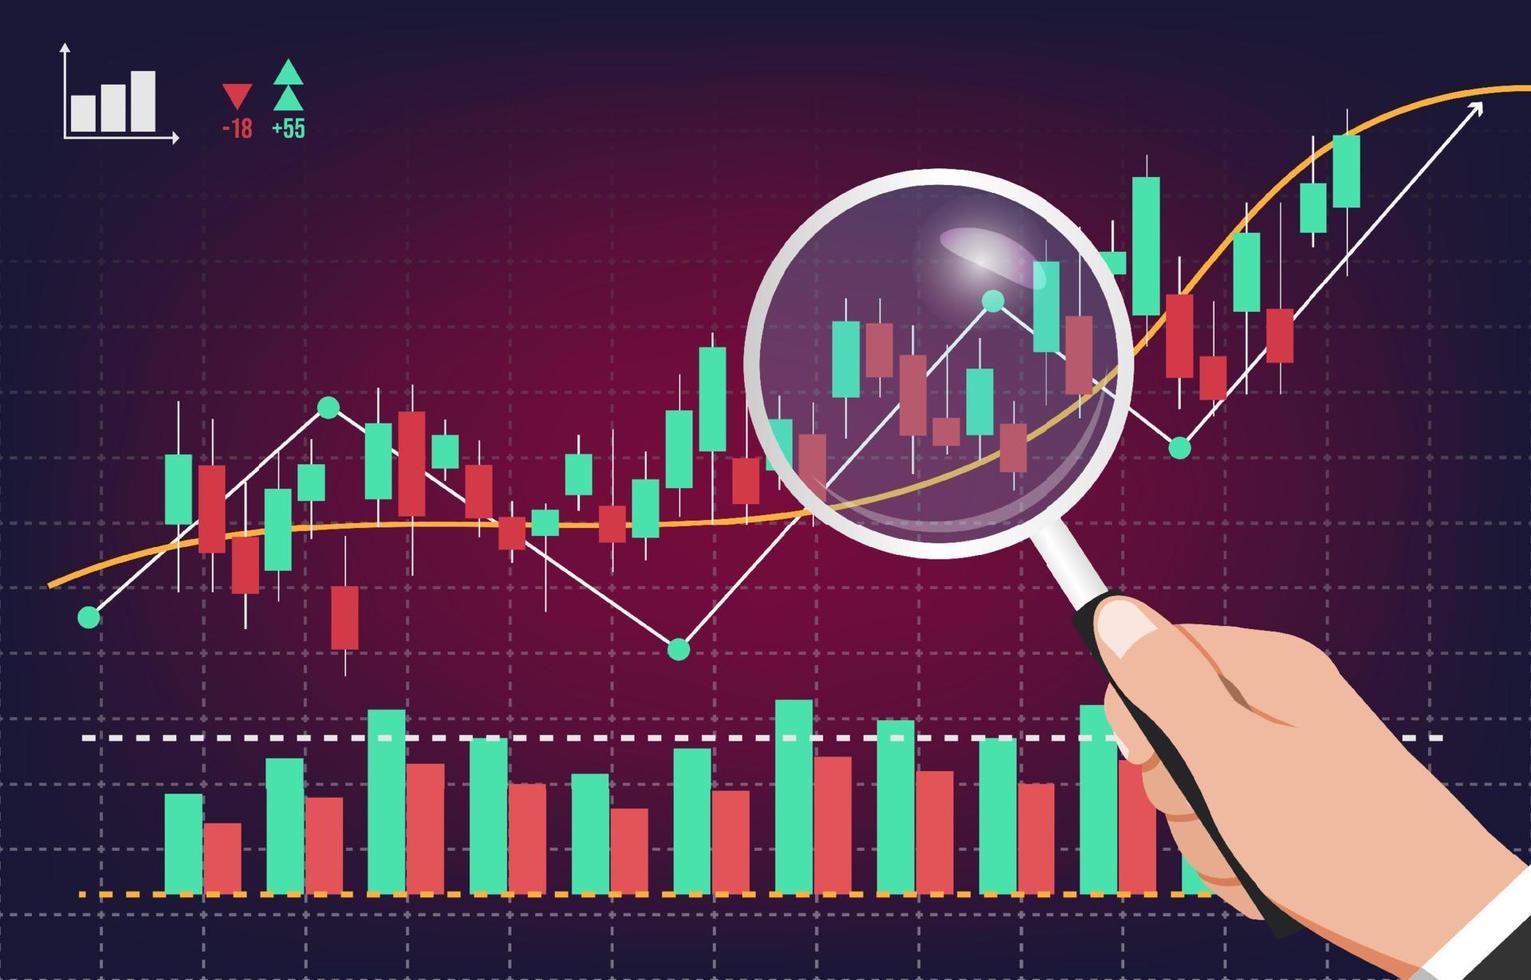
Technical Tools and Volatility Management
Technical indicators offer a different lens for analyzing market behavior by studying past price and volume data. Moving averages smooth out short-term fluctuations to reveal underlying trends; crossovers between short- and long-term averages can signal entry or exit points. The Relative Strength Index (RSI) measures momentum, indicating whether an asset is overbought or oversold. Divergences between price and RSI can warn of potential reversals. Support and resistance levels, derived from historical price action, help traders set entry and exit points. A breach of these levels often signals strength or weakness.
Volatility is often feared, but it also presents opportunities. Economic indicators like employment data, consumer spending, and central bank policies drive market swings. Interest rate changes, in particular, can cause significant volatility. Understanding these drivers allows investors to navigate uncertainty. Investor psychology—fear and greed—amplifies market movements. Fear can lead to panic selling, while greed fuels buying frenzies. Recognizing these emotional forces helps investors maintain discipline and focus on long-term goals.
The Psychology of Investing
Emotions and cognitive biases heavily influence investment decisions. Fear and greed drive market cycles: greed inflates prices during bull markets, and fear triggers sell-offs during downturns. Biases such as loss aversion and confirmation bias can cloud judgment, leading to poor choices like holding losing positions too long or ignoring contrary evidence. Building mental resilience through self-reflection and predefined strategies helps investors stay objective. Maintaining a long-term perspective allows them to weather short-term fluctuations and achieve sustainable success.
Q&A
What role do earnings reports play in stock market analysis?
Earnings reports provide a snapshot of a company's financial performance, including revenue, net income, and earnings per share. They help investors assess profitability and growth potential, guiding buy, hold, or sell decisions.
How do market indexes help investors understand the stock market?
Market indexes like the S&P 500 track a collection of stocks to represent overall market performance. They serve as benchmarks, allowing investors to compare individual stocks against broader trends and make strategic choices.
What are technical indicators, and how do they assist in trading decisions?
Technical indicators are calculations based on historical price and volume data, such as moving averages and RSI. They help traders identify trends, momentum, and reversal points to inform entry and exit strategies.
Why is understanding volatility trends important for investors?
Volatility measures price variation over time, indicating risk and potential reward. Higher volatility offers opportunities but also greater risk. Understanding it helps investors hedge or diversify portfolios to manage exposure.
How does trading volume influence investor behavior in the stock market?
Trading volume shows market activity and liquidity. High volume often signals strong interest and can amplify price moves; low volume may indicate uncertainty. Analyzing volume helps gauge sentiment and timing.